
Case study · Logistics
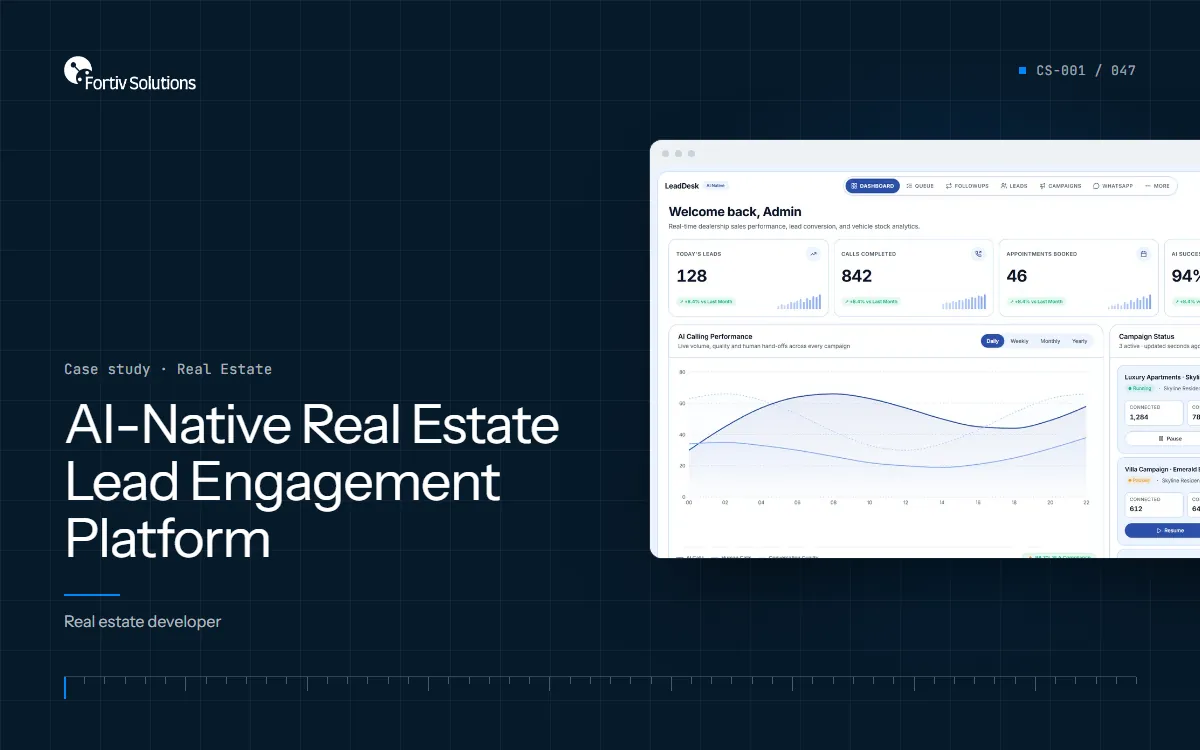
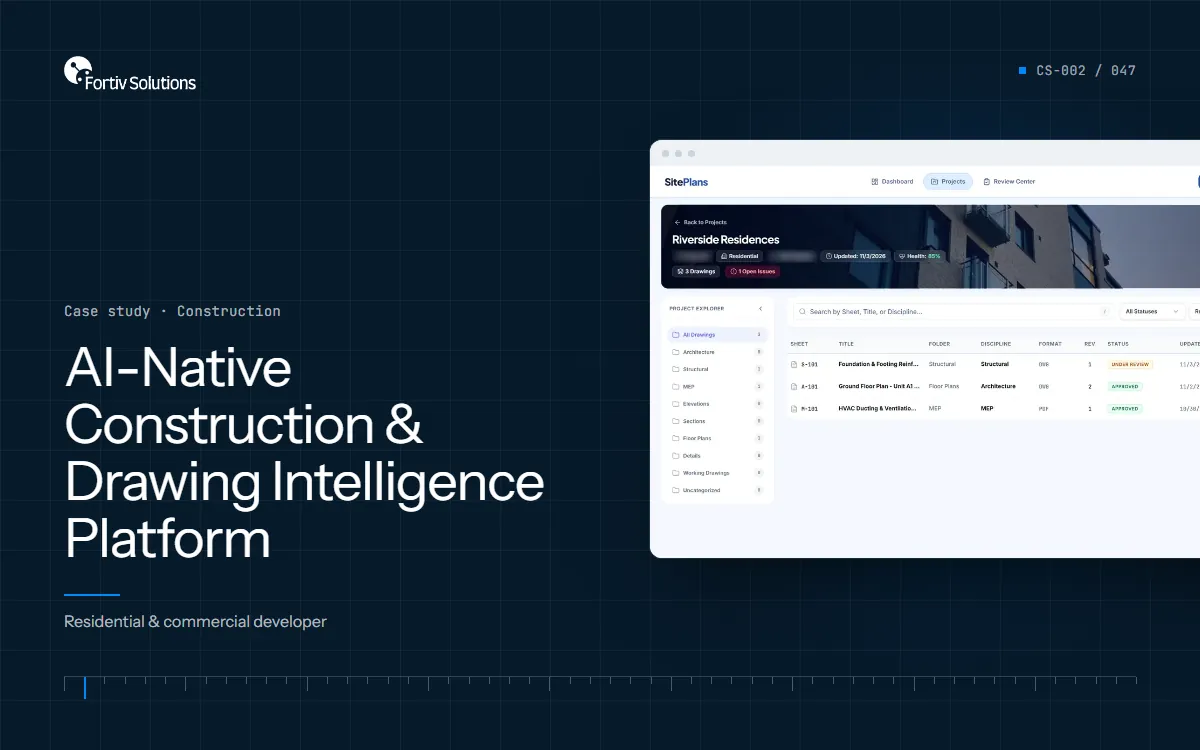
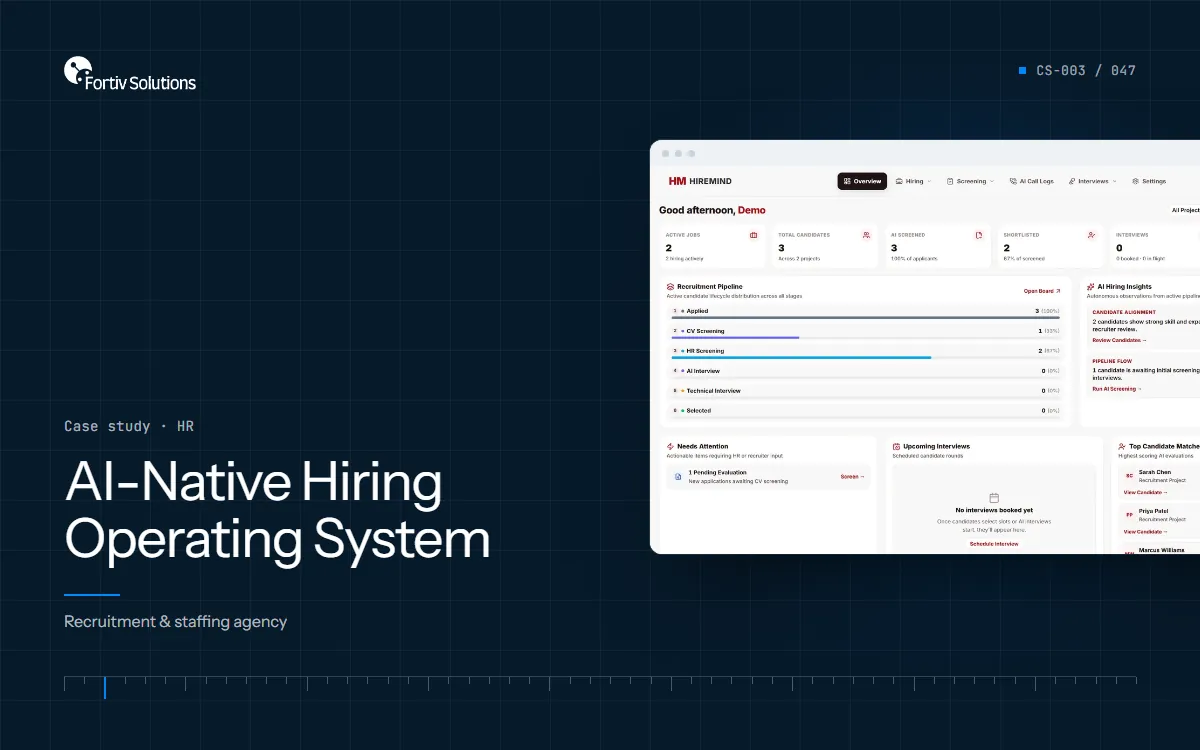
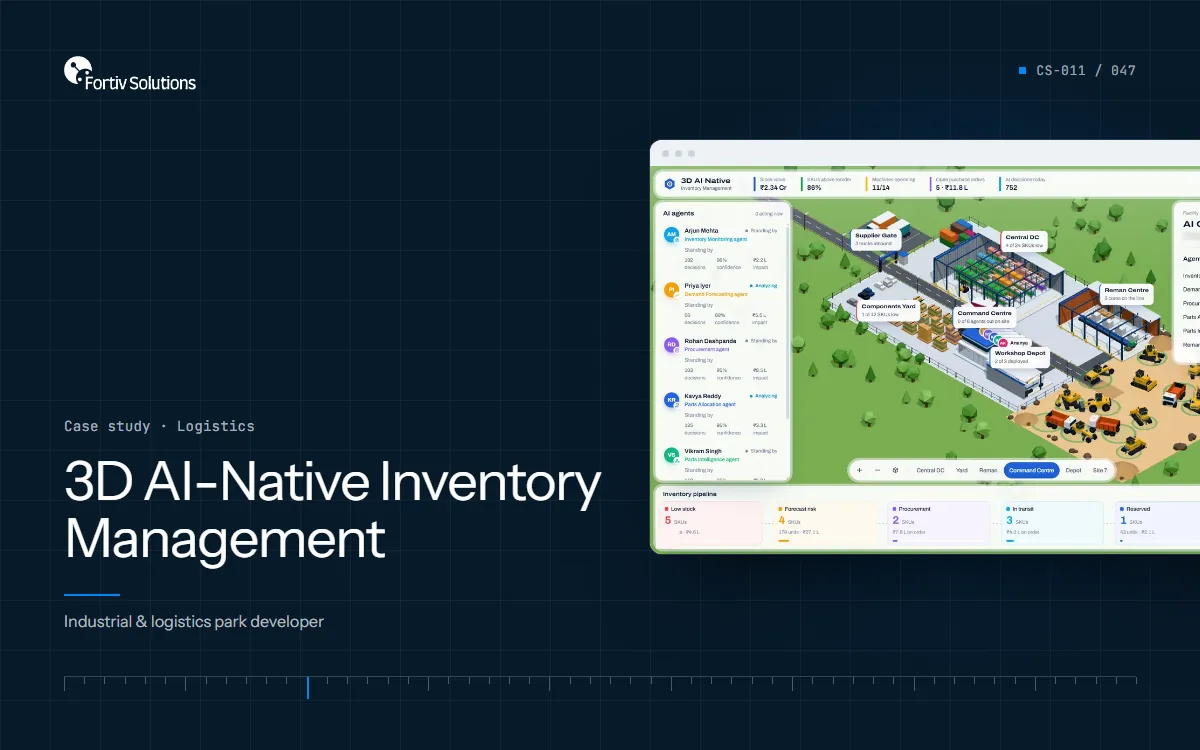
3D AI-Native Inventory Management
Warehousing sheds, open yards, loading docks and repair workshops leased to logistics and manufacturing tenants.
Engagement record
- Client
- Industrial & logistics park developer
- Industry
- Logistics
- System
- 3D digital twin · Warehouse inventory · AI agents
About this write-up
This case study describes the engagement as recorded. The client is not named; figures and outcomes are as reported by the client and have not been independently audited.
The challenge
Large logistics tenants wanted real-time operational visibility before signing long leases, and the park had no way to show live stock, dock and equipment status.
Objectives
- Live 3D park view
- Bin fill levels
- Six AI agents
- Inventory pipeline
Discovery
We built this 3D inventory platform for a developer of industrial and logistics parks. Warehouses, yards and loading docks appear as a live 3D model, with every rack and bin coloured by how full it is. Six AI agents watch stock levels, forecast demand, raise purchase orders, direct incoming freight, track equipment health and manage repairs — and tenants each see only their own sheds.
What was built
- Live 3D park view. Sheds, yards, docks and roads in 3D — orbit, zoom and click any building for its details.
- Bin fill levels. Every rack and storage slot coloured by how full it is, with warnings when stock runs low.
- Six AI agents. Agents for stock monitoring, demand forecasting, procurement, freight allocation, equipment health and repairs.
- Inventory pipeline. Stock grouped as available, reserved, in transit, on order, low or at risk — click a stage to highlight it in 3D.
- Yard and fleet tracking. Live positions of incoming trucks, forklifts and service vehicles on the park's roads.
- Connects to tenant systems. Pulls from tenant ERP and warehouse systems and from RFID gates at the park entrance.
Outcomes as reported
Reported summary: −40% — days on market for new leases.
| Figure | What it refers to |
|---|---|
| −40% | Days on market for new leases |
| −30% | Equipment and asset downtime |
| +18–25% | Rental premium for the park |
Figures as reported in the engagement record; not independently audited.