
Case study · Real Estate
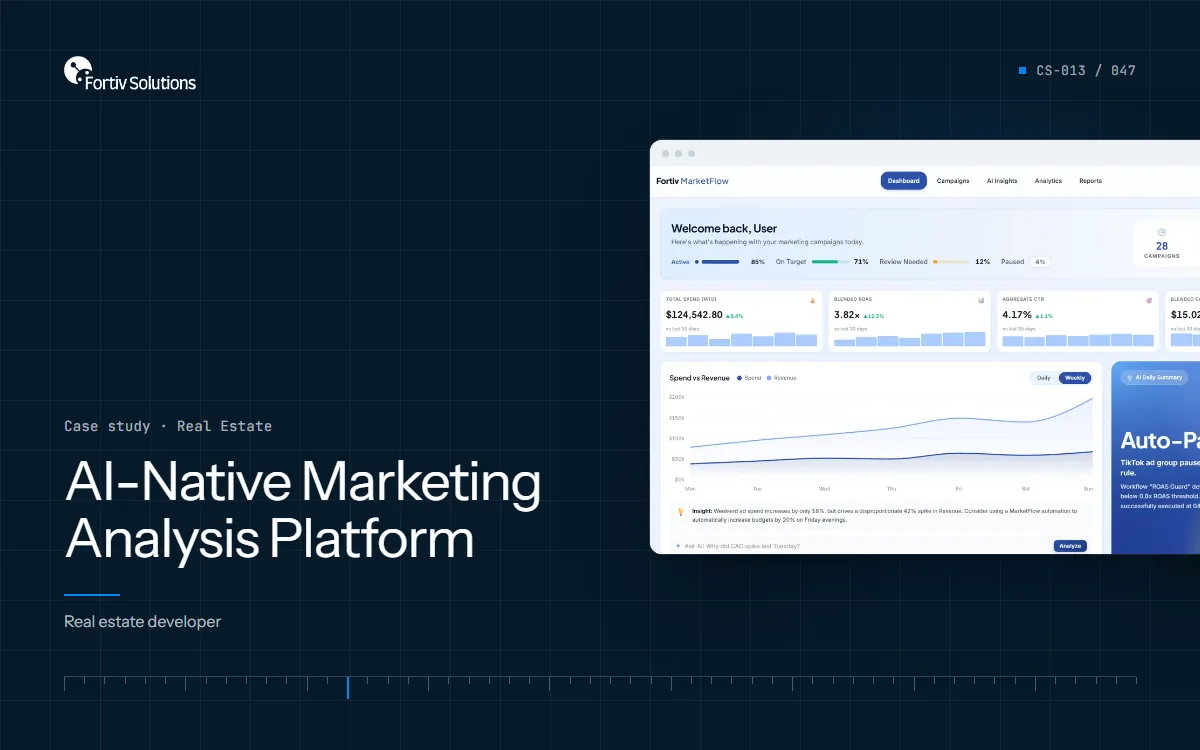
AI-Native Marketing Analysis Platform
Several residential projects marketed across digital ads, property portals, channel partners and outdoor media.
Engagement record
- Client
- Real estate developer
- Industry
- Real Estate
- System
- Ad spend analysis · Site visit attribution · Budget optimisation
About this write-up
This case study describes the engagement as recorded. The client is not named; figures and outcomes are as reported by the client and have not been independently audited.
The challenge
Marketing was judged on cost per lead, with no view of which ads actually produced site visits or bookings. Overspending campaigns ran for days before anyone noticed, and brokers disputed who had brought each buyer.
Objectives
- One view of every project
- Ads traced to bookings
- Automatic budget shifts
- Wasted-spend alerts
Discovery
We built this marketing analysis platform for a real estate developer running several projects at once. It brings ad spend from Meta, Google and property portals together with CRM leads, site-visit check-ins and bookings, so every booking can be traced back to the ad that started it. It flags wasted spend within minutes, moves budget toward campaigns that bring real visitors, and answers marketing questions in plain English.
What was built
- One view of every project. Spend, leads, site visits and bookings for every project, phase and tower on one screen.
- Ads traced to bookings. Site-visit check-ins and bookings matched back to the ad click that started them.
- Automatic budget shifts. Budget moves toward campaigns and unit types that bring visitors, within set spending caps.
- Wasted-spend alerts. Campaigns with rising costs, fake form fills or tired creatives are flagged or paused within minutes.
- Broker vs direct attribution. Shows when a broker-claimed buyer first came through the developer's own ads.
- Ask in plain English. Ask which campaign drove the most site visits last weekend and get the answer straight away.
Outcomes as reported
Reported summary: −35% — wasted ad spend.
| Figure | What it refers to |
|---|---|
| −35% | Wasted ad spend |
| +42% | Qualified site visits |
| < 15 min | To catch runaway ad spend, down from days |
Figures as reported in the engagement record; not independently audited.